In the present paragraph we want to deal with Network checks, which happens to be a wide subject. Since it's difficult to nail down a narrow path, we will focus on Network status from the PrivateServer Appliance point of view.
This means checking that the appliance's network configuration is working as expected to be. Also we will suggest to you some deeper checking to deal with top level debuggings.
We can't provide to you the necessary Network Management and Protocol Layers background. To fully understand the following parts you need to have good expertise about:
It would also help to know something about the SIP protocol itself.
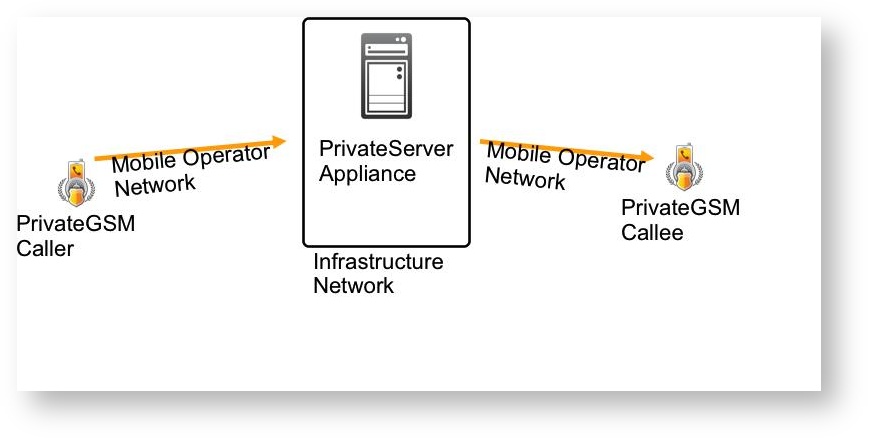
In the voice exchange system's world, the network is usually divided in two legs:
The above distinction is made from a logical network design point of view. In a real world implementation you would probably have almost three logical networks (as in the following figure).
 |
The Network check should be performed on the full end-to-end communication channel, which is the sum of the aboves. On each network we should measure the following features:
Network behavior and quality are crucial to provide a good quality service. Some requirements are mandatory to operate a Secure Call Service, other requirements affects the Service quality, ranging from “Secure Call not very good” to “impossible to Secure Call”.
Check Operational Requirements for more details on pre-requisites.
Given the above considerations, requirements and thresholds, we are going to measure the Infrastructure network. The following tests would perform the Infrastructure Network mostly, but we want to stress that a good Network test should involve the whole communication channels.
The first test to perform is about the Packet Loss percentage, as this can lead both to a Bad Quality communications (ie: gaps made of silence during the Secure Call) or worse: can't place calls at all. We are going to measure the packet loss percentage between the PrivateServer appliance and an user network. This case is not always possible, but it's worthy. A simple way to run such test is using the well know "ping" network application. In the below box you can have a session example of the test:
myhost:~ user$ sudo ping -i 0.02 pbx.mydomain.it Password: PING pbx.mydomain.it (x.x.x.x): 56 data bytes Request timeout for icmp_seq 0 64 bytes from x.x.x.x: icmp_seq=0 ttl=52 time=33.181 ms 64 bytes from x.x.x.x: icmp_seq=1 ttl=52 time=32.776 ms 64 bytes from x.x.x.x: icmp_seq=2 ttl=52 time=32.981 ms (cut) 64 bytes from x.x.x.x: icmp_seq=26 ttl=52 time=32.929 ms Request timeout for icmp_seq 28 Request timeout for icmp_seq 29 Request timeout for icmp_seq 30 Request timeout for icmp_seq 31 Request timeout for icmp_seq 32 Request timeout for icmp_seq 33 Request timeout for icmp_seq 34 64 bytes from x.x.x.x: icmp_seq=27 ttl=52 time=166.420 ms 64 bytes from x.x.x.x: icmp_seq=28 ttl=52 time=177.813 ms 64 bytes from x.x.x.x: icmp_seq=29 ttl=52 time=157.993 ms 64 bytes from x.x.x.x: icmp_seq=30 ttl=52 time=137.820 ms 64 bytes from x.x.x.x: icmp_seq=31 ttl=52 time=117.704 ms 64 bytes from x.x.x.x: icmp_seq=32 ttl=52 time=97.595 ms 64 bytes from x.x.x.x: icmp_seq=33 ttl=52 time=77.412 ms 64 bytes from x.x.x.x: icmp_seq=34 ttl=52 time=57.694 ms 64 bytes from x.x.x.x: icmp_seq=35 ttl=52 time=37.520 ms 64 bytes from x.x.x.x: icmp_seq=36 ttl=52 time=33.108 ms 64 bytes from x.x.x.x: icmp_seq=37 ttl=52 time=32.812 ms 64 bytes from x.x.x.x: icmp_seq=38 ttl=52 time=32.999 ms 64 bytes from x.x.x.x: icmp_seq=39 ttl=52 time=32.800 ms 64 bytes from x.x.x.x: icmp_seq=40 ttl=52 time=33.008 ms 64 bytes from x.x.x.x: icmp_seq=41 ttl=52 time=33.147 ms 64 bytes from x.x.x.x: icmp_seq=42 ttl=52 time=32.920 ms 64 bytes from x.x.x.x: icmp_seq=43 ttl=52 time=32.464 ms 64 bytes from x.x.x.x: icmp_seq=44 ttl=52 time=32.752 ms 64 bytes from x.x.x.x: icmp_seq=45 ttl=52 time=32.849 ms (cut) 64 bytes from x.x.x.x: icmp_seq=77 ttl=52 time=32.928 ms 64 bytes from x.x.x.x: icmp_seq=78 ttl=52 time=32.939 ms 64 bytes from x.x.x.x: icmp_seq=79 ttl=52 time=32.642 ms 64 bytes from x.x.x.x: icmp_seq=80 ttl=52 time=32.607 ms 64 bytes from x.x.x.x: icmp_seq=81 ttl=52 time=33.014 ms Request timeout for icmp_seq 89 64 bytes from x.x.x.x: icmp_seq=82 ttl=52 time=177.517 ms 64 bytes from x.x.x.x: icmp_seq=83 ttl=52 time=156.260 ms 64 bytes from x.x.x.x: icmp_seq=84 ttl=52 time=167.954 ms 64 bytes from x.x.x.x: icmp_seq=85 ttl=52 time=147.863 ms 64 bytes from x.x.x.x: icmp_seq=86 ttl=52 time=128.795 ms 64 bytes from x.x.x.x: icmp_seq=87 ttl=52 time=108.620 ms 64 bytes from x.x.x.x: icmp_seq=88 ttl=52 time=88.418 ms 64 bytes from x.x.x.x: icmp_seq=89 ttl=52 time=68.235 ms 64 bytes from x.x.x.x: icmp_seq=90 ttl=52 time=48.077 ms 64 bytes from x.x.x.x: icmp_seq=91 ttl=52 time=33.022 ms 64 bytes from x.x.x.x: icmp_seq=92 ttl=52 time=32.770 ms 64 bytes from x.x.x.x: icmp_seq=93 ttl=52 time=32.700 ms 64 bytes from x.x.x.x: icmp_seq=94 ttl=52 time=32.623 ms 64 bytes from x.x.x.x: icmp_seq=95 ttl=52 time=33.059 ms 64 bytes from x.x.x.x: icmp_seq=96 ttl=52 time=32.796 ms 64 bytes from x.x.x.x: icmp_seq=97 ttl=52 time=32.915 ms 64 bytes from x.x.x.x: icmp_seq=98 ttl=52 time=32.720 ms 64 bytes from x.x.x.x: icmp_seq=99 ttl=52 time=33.093 ms (cut) 64 bytes from x.x.x.x: icmp_seq=329 ttl=52 time=32.493 ms 64 bytes from x.x.x.x: icmp_seq=330 ttl=52 time=32.861 ms 64 bytes from x.x.x.x: icmp_seq=331 ttl=52 time=32.650 ms ^C --- pbx.madama.at ping statistics --- 334 packets transmitted, 326 packets received, 2.4% packet loss round-trip min/avg/max/stddev = 32.318/46.645/182.436/35.768 ms |
The test aims to simulate a network traffic with voice packets. As the voice packets are sent any 200 ms, the ICMP packets forged by the ping command "ping -i 0.02 pbx.mydomain.it" perform almost the same way. As a matter of fact we can read in the bottom line the test results. In particular we focus on the "2.4% packet loss", which is way over our basic threshold for a good Secure Call performance.
The round trip measure has to be performed on the SIP protocol to have some debugging value. Thus we can desume the round trip by the client log, as a first step before deciding to choose a deeper investigation. Here we report an excerption from a client's log. When performing this analysis we look for a "REGISTER" request by our client and we note the time the message has been sent:
27/mar/2012 16:00:59 <SipConnector-0> Created TcpConnection TLS:10.212.1.115:56744<->78.47.213.169:1043 27/mar/2012 16:00:59 <Connection-1> Connection thread started 27/mar/2012 16:00:59 <SipConnector-0> Created transport Connection-1 27/mar/2012 16:00:59 <SipConnector-0> [Notification] Status SIP progress=35% "Invio richiesta..." 27/mar/2012 16:00:59 <SipConnector-0> [SIP CONNECTOR] state=CONNECTING: sendMessage() 27/mar/2012 16:00:59 <SipConnector-0> [SIP CONNECTOR] state=CONNECTING: sendRegisterMessage() setting reg expiry = 1800 27/mar/2012 16:00:59 <SipConnector-0> ******* SENT on TLS:10.212.1.115:56744<->78.47.213.169:1043 ********** REGISTER sip:rendezvous.privatewave.com SIP/2.0 Via: SIP/2.0/TLS 10.212.1.115:56744;rport;branch=z9hG4bK43077 Max-Forwards: 70 To: "636143092" <sip:636143092@rendezvous.privatewave.com> From: "636143092" <sip:636143092@rendezvous.privatewave.com>;tag=z9hG4bK06836115 Call-ID: 661027548632@10.212.1.115 CSeq: 88101938 REGISTER Contact: <sip:636143092@10.212.1.115:56744;transport=tls> Expires: 1800 User-Agent: PGSM-10.5.2429-android Content-Length: 0 Allow: INVITE, ACK, CANCEL, OPTIONS, BYE, REFER, NOTIFY, MESSAGE, SUBSCRIBE, INFO |
So in the above excerption the REGISTER message was sent at 16:00:59 (which is 4:00:59 pm).
The time informations are written in minutes:seconds:hundredths |
Now let's check when did the server answer to the client with a SIP "200 OK" message and then let's have some math:
27/mar/2012 16:01:02 <Connection-1> ################ RECEIVED on TLS:10.212.1.115:56744<->78.47.213.169:1043 ################ SIP/2.0 200 OK Via: SIP/2.0/TLS 10.212.1.115:56744;branch=z9hG4bK43077;received=217.200.200.253;rport=58158 From: "636143092" <sip:636143092@rendezvous.privatewave.com>;tag=z9hG4bK06836115 To: "636143092" <sip:636143092@rendezvous.privatewave.com>;tag=as78ad5e96 Call-ID: 661027548632@10.212.1.115 CSeq: 88101938 REGISTER Server: PBX Allow: INVITE, ACK, CANCEL, OPTIONS, BYE, REFER, SUBSCRIBE, NOTIFY, INFO, PUBLISH Supported: replaces, timer Expires: 1800 Contact: <sip:636143092@10.212.1.115:56744;transport=tls>;expires=1800 Date: Tue, 27 Mar 2012 14:00:06 GMT Content-Length: 0 |
So the client received the answer at 16:01:02. This means that the roundtrip between client and server is the difference between the command sent (16:00:59) and the answer received (16:01:02), which is:
16:01:02 - 16:00:59 = --------------- 00:01:03 |
So the roundtrip result is almost 1 seconds, which is border line outcome by our basic threshold statements.
For this consideration the output of the "ping" command is useful, but it still needs a human eye pair to understand it correctly. The "ping" outcome about jittering won't be written down in an easy to read output line, instead it needs to be deduced by the time variation each line shows up.
For example let's focus on the following lines extracted by the previous example:
64 bytes from x.x.x.x: icmp_seq=78 ttl=52 time=32.939 ms 64 bytes from x.x.x.x: icmp_seq=79 ttl=52 time=32.642 ms 64 bytes from x.x.x.x: icmp_seq=80 ttl=52 time=32.607 ms 64 bytes from x.x.x.x: icmp_seq=81 ttl=52 time=33.014 ms Request timeout for icmp_seq 89 64 bytes from x.x.x.x: icmp_seq=82 ttl=52 time=177.517 ms 64 bytes from x.x.x.x: icmp_seq=83 ttl=52 time=156.260 ms 64 bytes from x.x.x.x: icmp_seq=84 ttl=52 time=167.954 ms 64 bytes from x.x.x.x: icmp_seq=85 ttl=52 time=147.863 ms 64 bytes from x.x.x.x: icmp_seq=86 ttl=52 time=128.795 ms 64 bytes from x.x.x.x: icmp_seq=87 ttl=52 time=108.620 ms 64 bytes from x.x.x.x: icmp_seq=88 ttl=52 time=88.418 ms 64 bytes from x.x.x.x: icmp_seq=89 ttl=52 time=68.235 ms 64 bytes from x.x.x.x: icmp_seq=90 ttl=52 time=48.077 ms 64 bytes from x.x.x.x: icmp_seq=91 ttl=52 time=33.022 ms 64 bytes from x.x.x.x: icmp_seq=92 ttl=52 time=32.770 ms |
You might have noticed that the average response time is about 32/33 ms, but it suddenly delays until it gets a "request timeout". Then it perform better from the "177.517" ms back to a 32 ms average response speed.
This time variation in response to the ICMP request is the jitter. We should measure it on UDP packets inside a Secure Call, but as we can't perform it arbitrarily, we otherwise relay on the ICMP test which goes pretty close to a possible jitter issue.
For a non jitter network communication we should have almost the same response time for each packet.
If we are not sure about one client's behaviour and want to check out its network situation, then we first have to retrieve the user's name or peername (put some link here about this?). After that, we can check the client network history through the SIP Session Logs (link this to the SIP SessionLOG). Messages like "NETWORK_ERROR" or frequent "DISCONNECT" or "UNREGISTER", which might trigger a deeper analysis about the client status and its network performance.
Another method to debug a possible network issue in the client-server communication is to watch a live sip session. To perform such a test, first log in via SSH and the to the Asterisk Console (please refer to the related documentation to do so).
Using the Peername value, we can now set up a debug trace on a specified user this way:
ha1*CLI> sip set debug peer 922 SIP Debugging Enabled for IP: x.x.x.x |
In the above case we assume that the username/Peername is "922". The Asterisk server would answer with the client's IP address, if it's registered. Else you can get an answer as below:
ha1*CLI> sip set debug peer 913 Unable to get IP address of peer '913' |
Soon you should watch on the console all the SIP messages exchanged between PrivateServer Asterisk Service and the client. This method is usually usefull to understand if there are too many registration by one client or if the network link is somehow broken, such as the PrivateServer tries to send SIP messages to the client (ie: INVITE, OPTIONS, etc) with alternate luck.
When you think you're done with the Live SIP Session monitor, you can shut it down the following way:
ha1*CLI> sip set debug off |